Advances in Permafrost Monitoring
There have been various key advances in permafrost monitoring including new remote sensing techniques, ground-based measurements, and modelling approaches in recent years. These advances have greatly improved our ability to collect high-quality data on permafrost properties and predict permafrost changes under different climate scenarios. These monitoring efforts are critical for understanding and predicting the impacts of climate change on permafrost and the Earth's climate.
Permafrost, a subsurface layer of soil, rock, and ice that remains frozen (0°C) for at least two years (National Geographic, 2022), covers about a quarter of the Earth's landmass. It can be found on land and below the ocean floor. It is often found in Arctic regions such as Greenland, U.S (Alaska), Russia, China, and Eastern Europe but unlike sea ice or snow cover, permafrost is not visible on the ground surface. It is estimated to extend 12.9-17.8 million sq km in the northern-high-latitude and it accounts for 9 to 14 per cent of the exposed land surface area (Gruber, 2012). Permafrost is a critical component of the Earth's climate system and plays an important role in regulating the exchange of heat, water and carbon between the land and the atmosphere. It is also an important source of methane and carbon dioxide, which are potent greenhouse gases that contribute to global warming. Therefore, monitoring permafrost conditions and changes over time is crucial for understanding and predicting the impacts of climate change. In recent years, advances in technology and methods have enabled scientists to monitor permafrost more accurately and efficiently than ever before. This blog provides an overview of some of the key advances in permafrost monitoring, including new remote sensing techniques, ground-based measurements, and modeling approaches.
Spaceborne Technologies
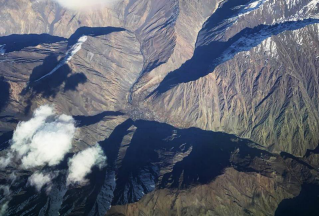
Remote sensing techniques have been used to study permafrost for several decades, but recent advances in satellite and airborne technologies have improved our ability to monitor permafrost at regional and global scales. For example, the Gravity Recovery and Climate Experiment (GRACE) Satellite Mission has provided valuable information on changes in permafrost properties like thickness and mass over time by measuring variations in the Earth's gravitational field. The European Space Agency's Sentinel-1 Satellite Mission has been used to create maps of permafrost extent and detect changes in permafrost temperature. Similarly, NASA's Advanced Spaceborne Thermal Emission and Reflection Radiometer (ASTER) has been used to measure surface temperatures in regions containing permafrost. The most direct and comparable indicators of changes in permafrost are its temperature and the thickness of the layers (Isaksen et al 2022), so this satellite data can be of utmost importance for monitoring and modelling of permafrost. Given below is a Land-cover map of the Arctic covering 1,500 km north to south to understand how thawing permafrost is changing the landscape. The map has been generated using information from the Copernicus Sentinel-1 and Sentinel-2 missions. Tones of yellow and beige show sparse vegetation, greens show tundra, purples show forest and reds show areas that have been disturbed by flooding or forest fires. Vegetation patterns alter snow redistribution and therefore heat transfer in winter and fires can trigger permafrost thaw (ESA, 2019).

Arctic land cover, contains modified Copernicus Sentinel data, processed by ZAMG
(Image source: Arctic land Cover 17/05/2019, ESA)
Satellite missions, such as the Advanced Land Observing Satellite (ALOS) and the European Space Agency's Sentinel Mission, have provided high-resolution images of permafrost landscapes, allowing scientists to identify and map changes in permafrost extent and vegetation cover.
In addition to satellites, airborne remote sensing techniques such as Light Detection and Ranging (LiDAR) have been used to study permafrost at higher resolutions. LiDAR can provide detailed 3D images of the ground surface, which can be used to identify features such as ice wedges and thermokarst pits indicative of permafrost degradation. Radar can penetrate through snow and vegetation cover to create an image of the subsurface, thus providing information on permafrost thickness and ice content.
In 2016, the Landsat data (optical remote sensing) was leveraged for utilising Normalised Differential Vegetative Indices (NDVI) as a proxy to characterise the stability of a railway embankment in a Permafrost region. This research used innovative methods to characterise permafrost degradation susceptibility along the deteriorating railway embankment of the Hudson Bay Railway (HBR) in northern Manitoba, Canada. A combination of track geometry analyses, geophysical explorations, and remote sensing techniques was used to locate and delineate the severity of the different stability challenges found along the HBR.
The analyses revealed that locations with high records of track geometry exceptions are likely underlain by thawing permafrost, whereas locations with low geometry exceptions tend to be devoid of permafrost. A comparison of the track exceptions against NDVI confirmed that locations with low NDVI have high records of track exceptions, which is indicative of permafrost degradation. The converse was found to also hold true (Priscilla Addison, 2016).
Ground-based/ In Situ Measurements Techniques
Ground-based measurements which involve direct observation of permafrost properties remain an essential tool for monitoring permafrost. Such techniques are used for validating and calibrating remote sensing data as well as for studying local-scale processes such as the thawing of ice-rich permafrost. In recent years, advances in technology have led to new and more accurate methods for measuring permafrost temperature, depth, and other properties and collecting high-quality data in challenging environments. One such technique is the use of fiber-optic sensors to measure soil temperature and moisture at multiple depths. These sensors can be installed in boreholes or buried in the ground to provide continuous, high-resolution data on permafrost temperature and active-layer thickness. In addition, automated weather stations can be used to monitor air temperature, humidity, and precipitation providing important information on the surface energy balance and its impact on permafrost.

Measuring Permafrost temperature in Boreholes based on the Experience in Swiss Alps, the 1987-borehole is marked with the right arrow. The 2015 replacement borehole is on the far left (left arrow) and the meteorological station on the far right. A permanent GNSS device with a solar panel is mounted on a large boulder to the right of the 2015-borehole. Photo: J. Noetzli, October 2019. (Image Source: Frontiers)
Modelling Approaches
Advances in modelling approaches have improved our ability to predict how permafrost will respond to climate change. One such approach is the use of coupled models that combine climate, vegetation and permafrost dynamics. These models can simulate the complex feedback between permafrost thaw, vegetation growth and carbon storage, and they can be used to explore different scenarios of future climate change.
Permafrost modelling, which uses computer simulations to predict permafrost changes under different climate scenarios, has become an increasingly important tool for understanding and predicting the impacts of climate change on permafrost. Lately, advances in modelling techniques and data availability have led to more accurate and detailed permafrost models. For example, the Permafrost Modeling Intercomparison Project (PMIP) has brought together modelling teams from around the world to compare and improve permafrost models, leading to significant advances in understanding and predicting permafrost changes.
Conclusion
Advances in permafrost monitoring have greatly improved our understanding of this critical component of the Earth's climate system. Remote sensing techniques have provided valuable information on changes in permafrost extent and thickness at regional and global scales, while ground-based measurements have improved our ability to collect high-quality data in challenging environments. Finally, modelling approaches have allowed us to explore and predict how permafrost will respond to future climate change. Satellites have the potential to observe several Essential Climate Variables (ECVs), yet despite their capabilities to record these spatially distributed data, operational monitoring of permafrost is problematic. In situ observations from the Global Climate Observing System’s (GCOS) Global Terrestrial Network for Permafrost (GTNP) provide useful information on borehole temperatures and active layer thickness that may be used to validate remotely sensed land surface temperature and freeze/thaw state products but crucially the measurements from this in situ observing system are not sufficient to validate other remotely sensed ECV data for permafrost. While field-based approaches have long been established, there is no simple procedure for monitoring permafrost from space; permafrost itself is a subsurface thermal condition of the ground that cannot be detected directly from space. Nonetheless, to study the possible impacts of rising air temperatures on permafrost conditions across the vast Arctic-Boreal region, satellite data is necessary (A. Trofaier et al., 2017). However, there is still much to learn about permafrost and ongoing research and monitoring efforts will be critical for predicting and mitigating the impacts of permafrost degradation on human societies and ecosystems.
References
A. Trofaiera, S. Westermannc, A. Bartschd, (2017). Progress in space-borne studies of permafrost for climate science: Towards a multi-ECV approach. Remote Sensing of Environment 203 55–70.
Gruber S., (2012). Derivation and analysis of a high-resolution estimate of global permafrost zonation. The Cryosphere, 6, 221–233.
Isaksen1 K., Lutz J., Sørensen A.M., Godøy O., FerrighiL., Eastwood S. and Aaboe S., (2022). Advances in operational permafrost monitoring on Svalbard and in Norway. Environmental Research Letter, 17 095012.
National Geographic. Permafrost. https://www.nationalgeographic.org/encyclopedia/permafrost/
Noetzli J, Arenson LU, Bast A, Beutel J, Delaloye R, Farinotti D, Gruber S, Gubler H, Haeberli W, Hasler A, Hauck C, Hiller M, Hoelzle M, Lambiel C, Pellet C, Springman SM, Vonder Muehll D and Phillips M (2021) Best Practice for Measuring Permafrost Temperature in Boreholes Based on the Experience in the Swiss Alps. Front. Earth Sci. 9:607875. doi: 10.3389/feart.2021.607875
The European Space Agency. Arctic land Cover (2019). https://www.esa.int/ESA_Multimedia/Images/2019/05/Arctic_land_cover
Priscilla Addison, Pasi Lautala, Thomas Oommen. (2016) Utilizing Vegetation Indices as a Proxy to Characterize the Stability of a Railway Embankment in a Permafrost Region. AIMS Geosciences, 2(4): 329-344.


Comments
Post a Comment